Help section
eFP Browser
This tool is an adaptation of the eFP Browser developed by Nicholas J. Provart et al. It visualizes the expression values of transcripts and metabolites in an intuitive way.
The user has to select a GeneId, ProbeId or MetaboliteId and experiment (data source). GeneId and MetaboliteId can be found through the search function.
Results
A figure shows the corresponding expression to the selected gene, probe or metabolite. Not for all experiments are figures provided yet. Besides this overview, the expression is also provides as a table and as bar chart (see the buttons below the figure).
Network analysis
Gene-to-Gene Co-Expression
With this analysis, the user is able to search for potential co-regulated genes. This may be the case, if the genes belong to the same pathway, have similar functions or are involved in similar biotic or abiotic responses.
Network parameters
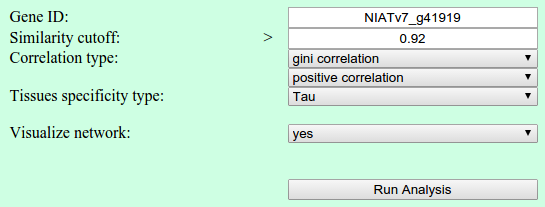
The user is able to select the gene of interest. Additional parameters for the network have to be selected, Similarity cutoff and Correlation type. The user can choose among three correlation methods. Furthermore, the direction of correlation can be selected, positive and negative. Additionally, the user can select the type of tissues specificity.
Results
The resulting co-expression network is represented in two ways: in a circular figure and in a table format.
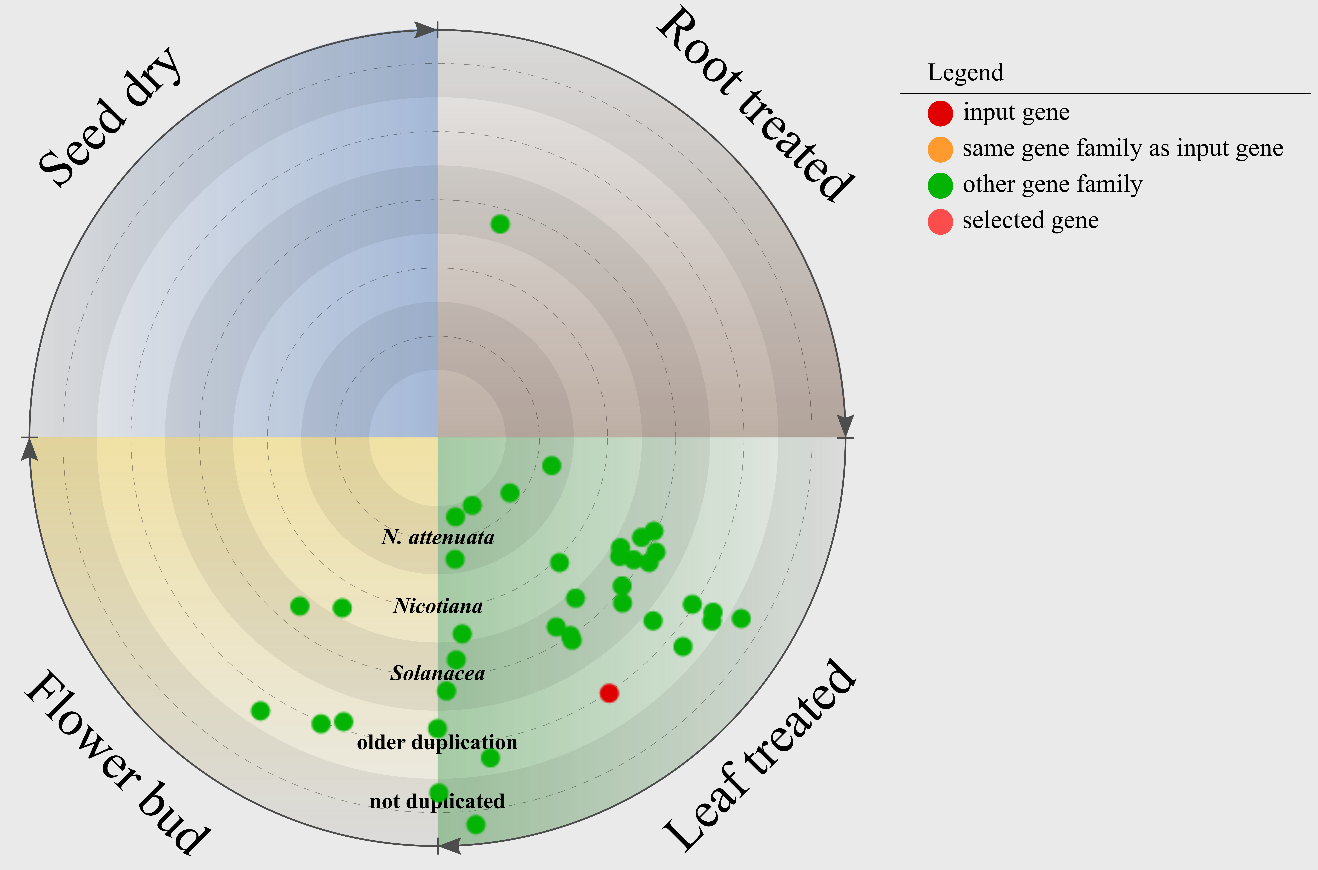
In the figure, all genes are represented as nodes and indicate that they are co-expressed to the input gene (red node) above the chosen threshold.
Genes belonging to the same gene family as the input gene have a orange color, otherwise they are represented as green nodes.
All dots are positioned on five circles. Each circle represents the most recent duplication of the containing genes.
The circle diagram is divided in four sections: leaf treated, root treated, flower bud and seed dry.
The position of the nodes in one of the quarters indicates the highest expressed tissues.
The positions within the four sections shows the tissues specificity of the gene expression within the for tissues (leaf treated, root treated, flower bud and seed dry).
The tissues specificity increases in clock-wise direction - in beginning represents a value of 0 and the end represents a value of 1 indicating
the gene is expressed in all four tissues the same or the gene is only expressed in the shown tissues, respectively.
Metabolite-to-Gene Co-Expression
The user is able to search for co-expressed genes to a known metabolite. The results are presented in a similar way compared to the Gene-to-Gene Co-Expression network - please read the paragraph above.
Gene-to-Metabolite Co-Expression
With this analysis the user can detect metabolites that are potentially co-regulated with a gene of interest.
Network parameters
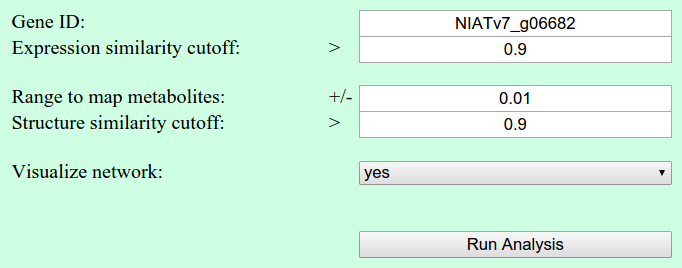
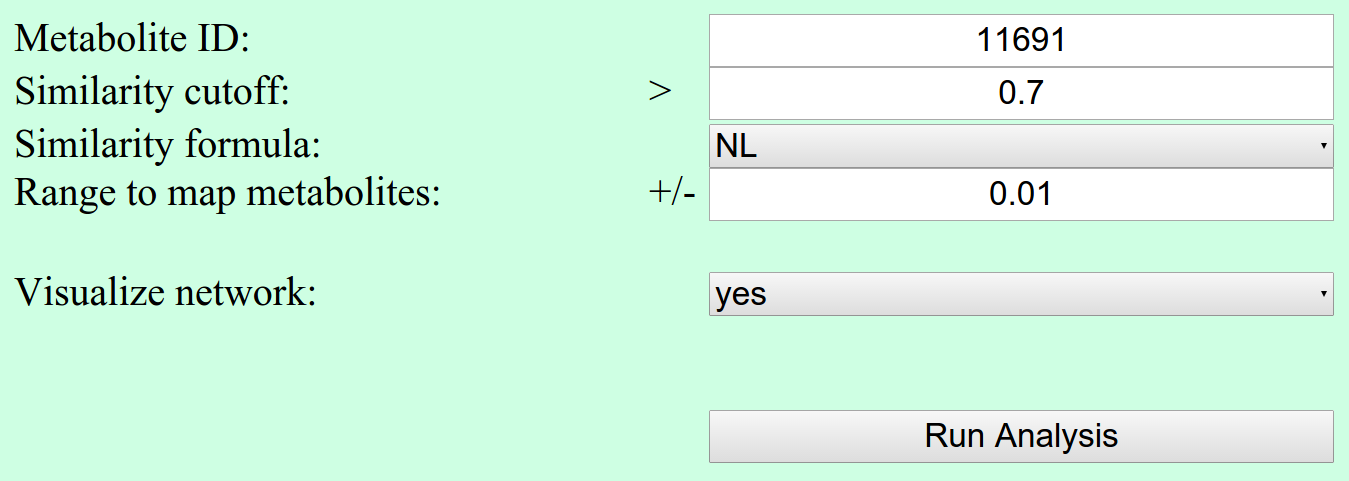
Similar to the Gene-to-Gene Co-Expression analysis, the user has to select a gene of interest and a cutoff for the similarity value. Additionally, it can be specified in which range the found metabolites should be mapped to already annotated metabolites in the database. Important for this mapping is their m/z value. Furthermore, a structure similarity cutoff can be selected, to visualize structure similarities based on Common Neutral Losses (NL) and Fragment Similarity (NDP).
Results
The resulting co-expression network is represented in two ways: in a figure and in a table format.
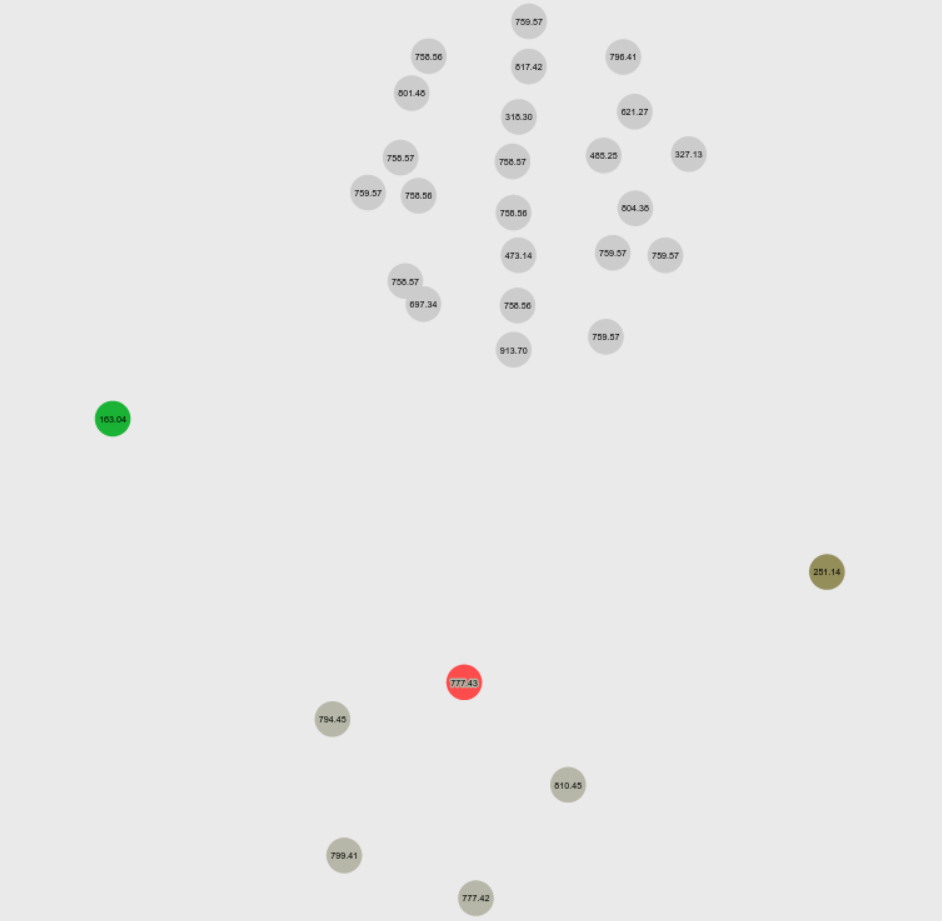
In the figure all found metabolites are represented as nodes. The color of the nodes indicates their metabolite class based on the annotation.
Each class of metabolites has their own color. However, unknown one are represented in grey.
Green and red edges shows the structure similarity between the connected metabolites. A left click on each element provides more information.
Gene-to-Metabolite Co-Expression
The user is able to search for co-expressed metabolites to a known gene. The results are presented in a similar way compared to the Gene-to-Metabolite Co-Expression network - please read the paragraph above.
Metabolite-to-Metabolite Co-Expression
The user is able to search for co-expressed metabolites to another metabolite. The results are presented in a similar way compared to the Gene-to-Metabolite Co-Expression network - please read the paragraph above.
Metabolite Structure similarity
With this analysis, the user is able to search for metabolites with similar structure.
Network parameters
Besides the metaboliteId and a similarity cutoff, the user has to specify the approach for structure similarities (Similarity formula). It can be chosen between structure similarity based on Common Neutral Losses (NL) and Fragment Similarity (NDP). For more background information to this two similarity measurements, check the publication by Li et al.
Results
The visualization of the results is similar to Gene-to-Metabolite Co-Expression analysis - please read the paragraph above.
Phylogenetic analysis
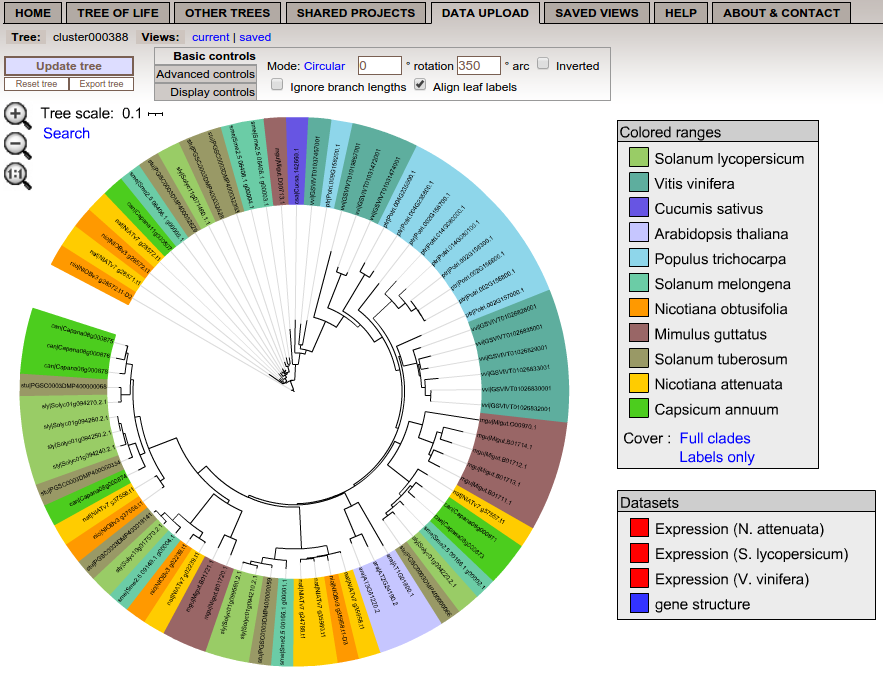
If the user specifies a geneId, the complete gene family with annotation will be uploaded and visualized with iTOL (Interactive Tree Of Life).
Results
The color of the genes represents corresponding plant species. Up to 11 species can be included depending on the gene family.
Besides the phylogenetic tree, additional datasets are uploaded - gene structure including exons and introns, and expression values for three species.
If the user clicks on it, it will be displayed.
On the top of the of the iTOL web page, the user can change the representation of the gene tree, e.g. display bootstrap values.
For a more detailed description about the user interface, please read the iTOL help page.