eFP Browser
Description:
With the "Electronic Fluorescent Pictograph" (eFP) Browser you have a ability to visualize expression data in an intuitive way. You can choose amoung several mircoarray experiments, as well as RNA-Seq and metabololic data.
This eFP Browser combines the data for 10 microarray experiments (256 microarrays), RNA-seq data of 20 tissues and Metabolite data of 14 tissues.
Here is a tutorial that describes this analysis.
This tool is an adaptation of the eFP Browser developed by Nicholas J. Provart et al.
Parameters:
Experiment information:
Title: RNA-Seq data from 20 tissues
Description:
RNA-Seq data from 20 tissues
Weblink:
Responsible person: tbrockmoeller
Visualisation
- This probe/gene set reaches its maximum signal intensity (expression potential) of 8.49 in the RNA-Seq data source with probeID of NIATv7_g41919.
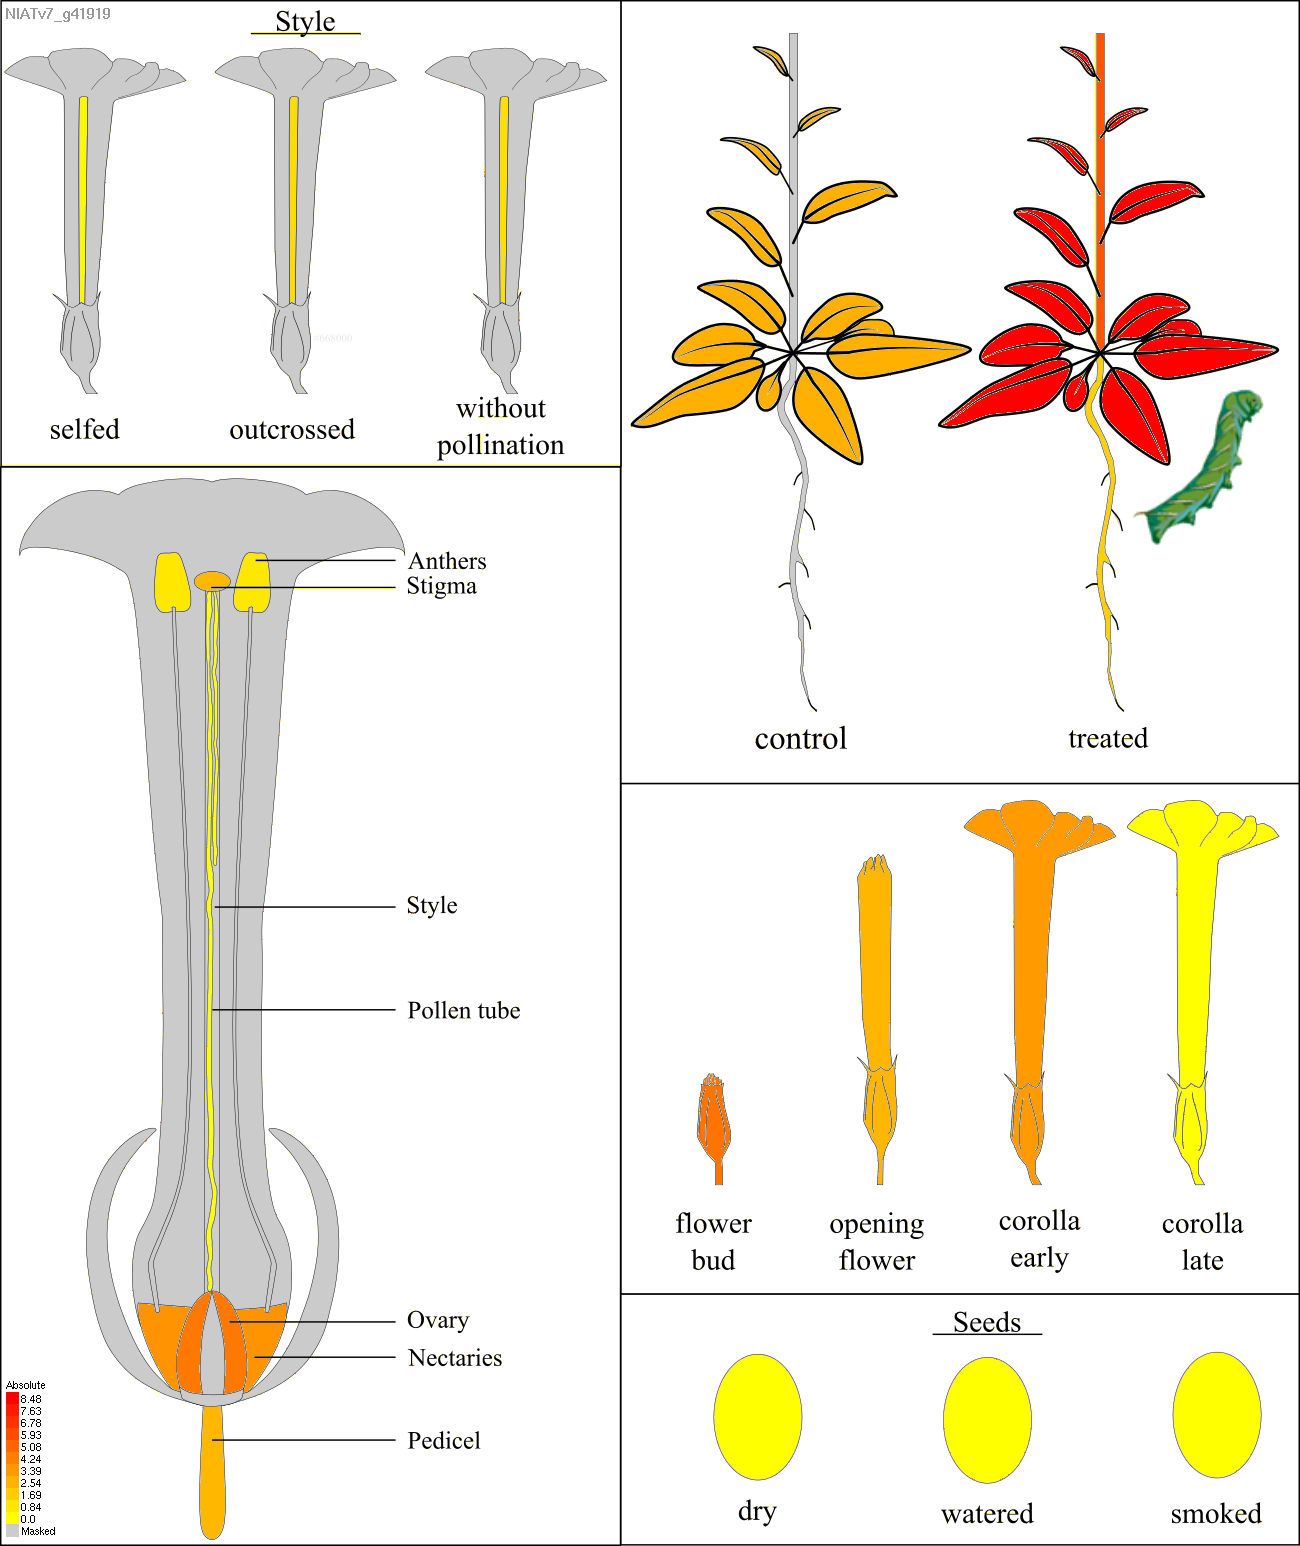
- CUST_151184_PI422650789, Na_454_37798, NIATv7_g41919, scaffold40556, scaffold40557 was used as the probe set identifier for your primary gene NIATv7_g41919. The mean of this probes was used as expression value.